Graph Dialog Box
The Graph dialog box allows you to view graphs and modify graph settings as desired. After you create a graph, you view it in the Graph dialog box.
The following controls are available:
| Graph Tab | Description |
|---|---|
 Add to Graph Manager |
Lets you save the Graph to the graph manager. When you click this button, the graph options (i.e., attributes to graph for a specific scenario) and the graph settings (i.e., line color, font size) are saved with the graph. If you want to view a different set of data (for example, a different scenario), you must change the scenario in the Graph Series Options dialog box. Simply switching the active scenario will not change the graph. Graphs that you add to the Graph manager are saved when you save your model, so that you can use the graph after you close and reopen Drainage and Utilities. |
 Add to Graph |
Opens a Select toolbar to allow you to select one or more elements from the drawing to add to the current graph. |
 Select In Drawing |
Selects the currently graphed element in the drawing view. |
 Series Options |
Opens a submenu containing the
following options:
|
 Print /Print Preview |
Opens a submenu offering the Print and Print Preview commands. Print prints the current view in the graph display pane; Print Preview opens the Print Preview Window , displaying the graph exactly as it will be printed. |
 Copy |
Copies the current view in the graph display pane to the Windows Clipboard. |
 Zoom Extents |
Zooms out so that the entire graph is displayed |
 Zoom Window |
Zooms in on a section of the graph. When the tool is toggled on, you can zoom in on any area of the graph by clicking on the chart to the left of the area to be zoomed, holding the mouse button, then dragging the mouse to the right (or, the opposite extent of the area to be magnified) and releasing the mouse button when the area to be zoomed has been defined. To zoom back out, click and hold the mouse button, drag the mouse in the opposite direction (right to left), and release the mouse button. |
  
Time (VCR) Controls |
Lets you evaluate plots over time. If you click Restart, the Time resets to zero and the vertical line that marks time resets to the left edge of the Graph display. If you click Pause, the vertical line that moves across the graph to mark time pauses, as does the Time field. If you click Play, a vertical line moves across the graph and the Time field increments. The following controls are also available: Time —Displays the time location of the vertical black bar in the graph display. This is a read-only field, to set a specific time, use the slider button. Slider —Lets you set a specific time for the graph. A vertical line moves in the graph display and intersects your plots to show the value of the plot at a specific time. Use the slider to set a specific time value. |
| Graph Display Pane | Displays the graph. |
| Data Tab | |
| Data Table |
850_GraphDialog_002.bmp The Data tab displays the data that comprise your graphs. If there is more than one item plotted, the data for each plot is provided. You can copy and paste the data from this tab to the clipboard for use in other applications, such as Microsoft Excel. To select an entire column or row, click the column or row heading. To select the entire contents of the Data tab, click the heading cell in the top-left corner of the tab. Use Ctrl+C and Ctrl+V to paste your data. The column and row headings are not copied. |
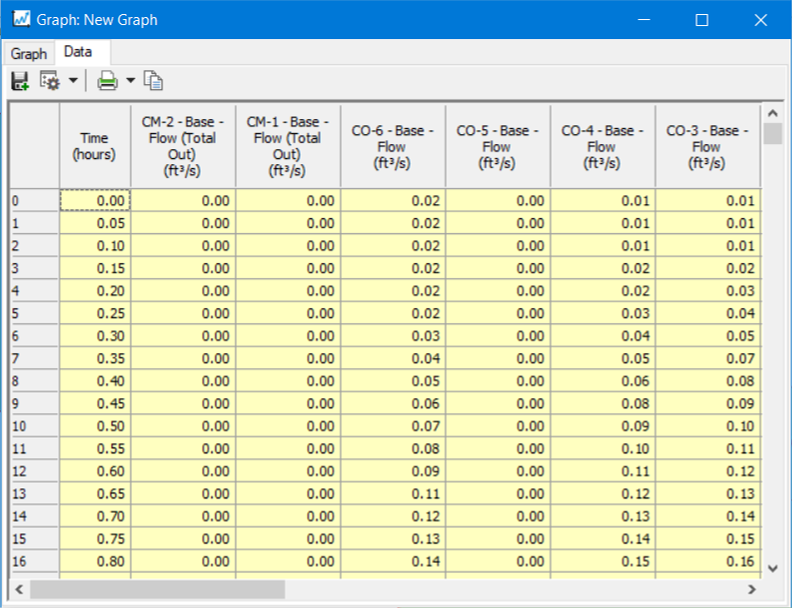
Note: The chart tab of the
graph will show all the detail possible, for all time step detail available, on
each plotted result line. For the data tab of graph the number of rows will
correspond to the 'Increment' declared in the 'Time Browser' toolbar window. If
you set the 'Increment' choice to '<All>' the Data tab will show all
possible reporting points (all rows).